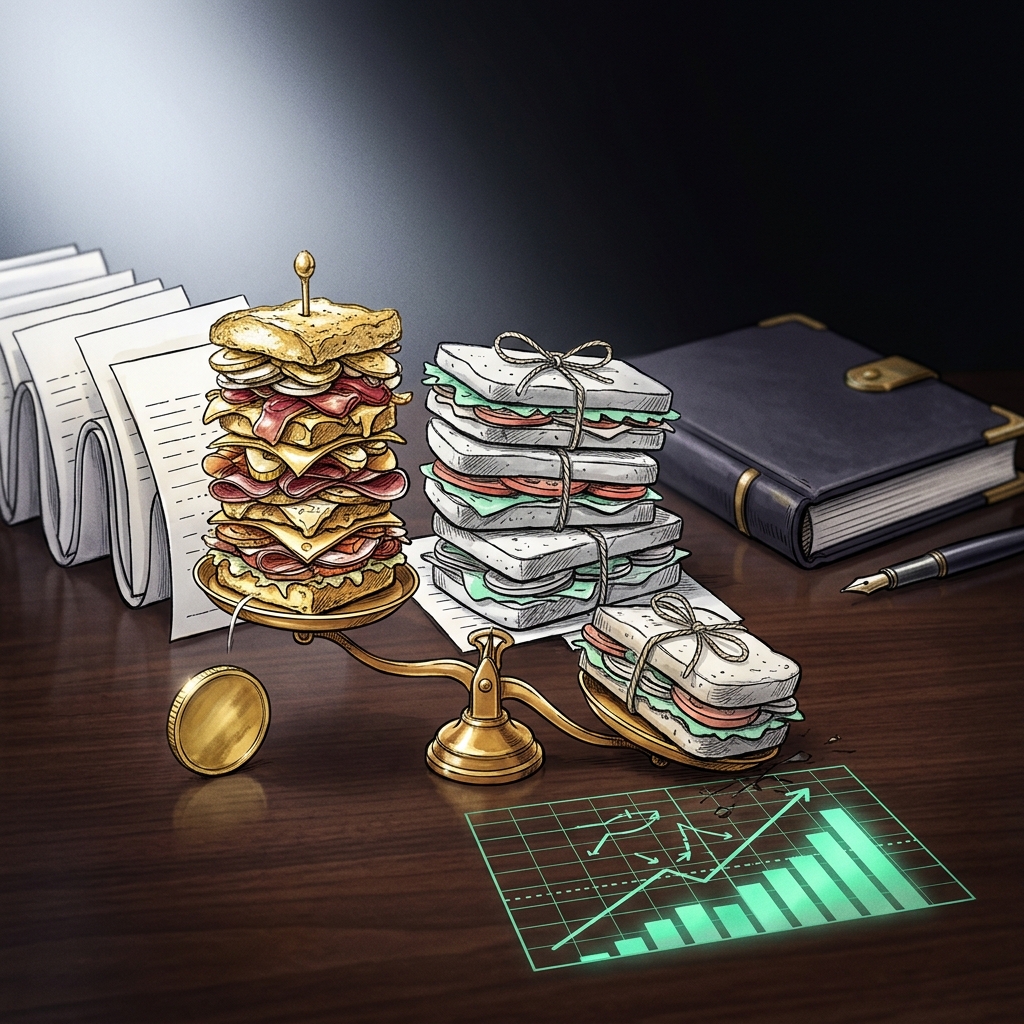
A restaurant break-even menu mix shift happens when adding low-margin items to a menu raises the total sales volume required to cover fixed costs, even when unit sales stay constant. Because break-even sales equal fixed costs divided by weighted contribution margin, diluting the average margin by 10 points can push the required sales threshold up by roughly 18 percent. Operators who model this before launching a value menu avoid the trap that hollowed out casual dining margins between 2023 and 2025.
The restaurant break-even menu mix shift math is unforgiving. When Denny's rolled out its $2 $4 $6 $8 Value Menu expansion in early 2024, same-store sales still went negative and franchisees pushed back publicly at the June 2024 franchisee conference, because the traffic lift did not offset the mix shift into lower-margin items. That is the pattern this guide will price out, in the numbers a GM or CFO can actually run against a P&L.
The Break-Even Formula and Why Mix Shift Breaks It
The textbook formula is simple: Break-Even Sales = Fixed Costs / Weighted Contribution Margin Percentage. A single-location full-service restaurant with $85,000 in monthly fixed costs (rent, salaried labor, insurance, utilities, debt service) and a 65 percent weighted contribution margin needs $130,769 in monthly sales to hit zero. Drop the weighted margin to 55 percent because the menu now leans on $9.99 promotional items, and the break-even sales figure jumps to $154,545. That is an 18.2 percent increase in required volume to earn the same zero-profit outcome.
The National Restaurant Association's 2024 State of the Restaurant Industry report flagged that 45 percent of operators expected competition to be more intense in 2024 than in 2023, and 38 percent said their restaurant was not profitable in 2023. Those two numbers together explain why value menus keep appearing and keep failing: operators feel forced to defend traffic, then discover the traffic they buy costs more than it brings in.
The Weighted Contribution Margin Calculation
To calculate weighted contribution margin, multiply each menu item's contribution margin percentage by its share of total revenue, then sum. A steak entree at 72 percent margin selling 15 percent of covers contributes 10.8 points. A $9.99 burger at 45 percent margin selling 25 percent of covers contributes 11.3 points. Do this for every menu category and the sum is the number that goes in the denominator.
The actionable step here is to pull 90 days of POS data, export item-level sales into a spreadsheet model, tag each item with its plate cost and menu price, and calculate the current weighted margin before you consider any menu change. Most operators skip this step and price promotions against gross margin rather than contribution margin, which is where the 18 percent creeps in unnoticed.
What the Chili's, Applebee's, and Red Lobster Data Actually Shows
Chili's parent Brinker International reported Q2 FY2025 (October December 2024) same-restaurant sales growth of 27.4 percent for Chili's, driven by the "3 for Me" value platform expansion and a viral TikTok promotion of the Triple Dipper. Brinker's Q2 FY2025 earnings release on January 29, 2025 credited operational simplification and margin discipline for translating that traffic into a 380 basis point improvement in restaurant operating margin. Chili's did the value play correctly: they cut menu complexity from 125 items to roughly 75 before adding the value tier, so the lower-margin items replaced higher-cost items rather than adding to them.
Applebee's parent Dine Brands, in its Q4 2024 earnings call on February 26, 2025, reported Applebee's domestic same-restaurant sales down 4.7 percent for the full year 2024. CEO John Peyton acknowledged that the "Really Big Meal Deal" at $9.99 drew traffic but pressured margins, and that franchisees were resistant to further discounting. Applebee's had not simplified its menu the way Chili's did, and the mix shift showed up as a margin hit without the offsetting operational simplification.
Red Lobster filed for Chapter 11 bankruptcy on May 19, 2024. The bankruptcy filing cited the $20 Endless Shrimp promotion, which had been made permanent in June 2023, as a contributor to $11 million in operating losses in 2023. Bloomberg's reporting on the filing (May 19, 2024) walked through the specific menu-mix damage: shrimp is a low-margin protein, and unlimited pricing drove a mix shift so severe that food cost as a percent of sales moved several points above the industry norm. That is the extreme end of the break-even menu mix shift trap.
The Pattern Across the Three Cases
- Chili's added a value tier after cutting SKUs. Weighted margin held. Traffic and margin both improved.
- Applebee's added a value tier without cutting SKUs. Weighted margin fell. Traffic came, margin left.
- Red Lobster made an unlimited promotion permanent on a low-margin protein. Weighted margin collapsed. The company filed Chapter 11.
Actionable takeaway: the sequence matters more than the price point. Simplify first, then discount. Never discount a protein whose unit contribution margin is already below your weighted average, because every incremental unit sold makes the break-even threshold worse.
Modeling the Shift Step by Step in Excel
Here is the step by step process for building a break-even menu mix shift model in a spreadsheet. This is the exact structure ModelStack's restaurant financial model template uses, and it maps to any full-service or fast-casual operation.
- Pull item-level sales for 90 days. Most POS systems (Toast, Square for Restaurants, Lightspeed) export a mix report as CSV. You want item name, units sold, gross revenue, and current menu price.
- Add plate cost per item. This comes from recipe cards or your inventory system. If you do not have recipe cards, build them for the top 20 items by revenue first. Those items typically drive 70 to 80 percent of sales.
- Calculate contribution margin per item. Contribution margin = (Menu Price - Plate Cost) / Menu Price. Do not confuse this with gross margin, which includes fixed labor allocations.
- Calculate revenue share per item. Item revenue divided by total revenue for the period.
- Calculate weighted contribution margin. Sum of (Contribution Margin x Revenue Share) for every item.
- Pull fixed costs from the P&L. Rent, salaried management, insurance, utilities, debt service, marketing retainers. Anything that does not vary with covers.
- Compute current break-even sales. Fixed Costs / Weighted Contribution Margin. This is your baseline.
- Model the proposed menu change. Add the new item with its projected price and plate cost, and adjust the mix (typically 15 to 25 percent of covers shift to a new value item in the first 60 days, based on the pattern Applebee's and Chili's disclosed).
- Recompute weighted contribution margin under the new mix. The difference between the old and new break-even sales figure is the mix shift cost, in dollars of monthly revenue.
Actionable takeaway: if the model shows a break-even lift greater than 10 percent, the value item needs to be paired with SKU removal or a price increase elsewhere. If the lift is greater than 20 percent, the menu change does not pencil, and you should walk away or restructure it before launch.
Fixed Cost Behavior in Restaurants Is Deceptive
Fixed costs in restaurants are not as fixed as the accounting textbook implies. The Federal Reserve Bank of Kansas City's Q4 2024 report on food-service margins noted that restaurant fixed cost inflation ran 6.8 percent in 2024, faster than menu price inflation of 4.1 percent. That gap means the break-even threshold moves up every quarter even when the menu does not change.
Add a menu mix shift on top of a rising fixed cost base and the compounding effect is punishing. If fixed costs rise 6.8 percent and weighted margin falls 10 points, break-even sales can jump 25 percent in a single year. That is the mechanism that drove Red Lobster's bankruptcy and that Applebee's is fighting now.
Three Fixed Costs That Are Actually Semi-Variable
- Salaried management. Adding a second GM or shift lead in response to volume growth converts fixed cost into a step cost. Model this at the volume thresholds where the hire happens, not as a smooth line.
- Utilities. Base charges are fixed but usage-based charges rise with covers. Pull the last 12 months of utility bills and separate the base from the variable component.
- Marketing. Retainer agencies are fixed. Performance marketing (Google Ads, DoorDash promotion fees) is variable. Categorize them separately in the model.
Actionable takeaway: rebuild the fixed cost stack quarterly. Do not carry a stale fixed cost number in the break-even model, because it will understate the real threshold by 5 to 10 percent within a year.
What to Do When the Mix Shift Is Already Happening
Most operators discover a break-even menu mix shift after the fact, when three or four consecutive months of solid traffic still produce declining profit. The recovery playbook has four moves, in order.
- Cut the bottom 20 percent of SKUs by contribution margin dollars. Every menu carries dead weight. Chili's cut from 125 items to 75 before launching 3 for Me, and the operational simplification funded the discount. Toast's 2024 restaurant industry report found the median full-service restaurant menu had grown 12 percent in item count since 2019 while covers per location fell 8 percent.
- Raise prices on the top 10 percent of items by revenue. These are the items customers came for. Elasticity on signature items is typically below 0.5, so a 5 percent price increase yields 3 to 4 percent revenue lift with minimal traffic loss. Darden Restaurants disclosed on its Q1 FY2025 earnings call (September 19, 2024) that Olive Garden had taken 3.5 percent of pricing in the year with minimal traffic impact on high-frequency signature items.
- Reprice or reformulate the value item. If the value item is losing money at the plate level, add a premium topping option that carries most of the margin. The upsell attach rate on value platforms runs 30 to 40 percent based on Chili's disclosed data, and the upsell is where the margin comes back.
- Renegotiate the two largest fixed costs. Rent and food distribution contracts are the two biggest fixed and semi-fixed lines. A 5 percent reduction in either line typically improves break-even sales by 3 to 4 percent.
Actionable takeaway: do the SKU cut before you touch pricing. Operators who raise prices without simplifying the menu tend to lose the customers they meant to keep, because the guest sees a price change but no operational improvement.
The Ratios Every Operator Should Track Monthly
The break-even model is only useful if it lives inside a monthly operating rhythm. Four ratios belong on the GM's dashboard, tracked against a rolling 90-day baseline.
- Weighted contribution margin percentage. Trend line, not a point-in-time reading. Any drop of more than 100 basis points in a month is a signal to pull the menu mix report.
- Break-even sales as a percentage of trailing sales. Above 90 percent is a red flag. Above 100 percent means the location is losing money at current volume.
- Fixed cost coverage ratio. Gross profit divided by fixed costs. Below 1.2x means one bad month wipes out the quarter.
- Mix concentration. Revenue share of the top 10 items. Rising concentration in low-margin items is the leading indicator of the mix shift trap.
The AICPA's 2024 Restaurant Industry Benchmark Report puts the median full-service operator's fixed cost coverage ratio at 1.35x. Anything below 1.15x is in the bottom quartile and typically precedes a covenant issue with the operating lender within two quarters.
Conclusion
Break-even math is the difference between a value menu that works and one that files for bankruptcy. The 18 percent sales threshold lift from a 10-point margin dilution is not a theoretical number, it is what killed Red Lobster, what Applebee's is fighting, and what Chili's avoided by simplifying first. The operators who build the model before the launch keep their margin. The ones who launch first and model later usually do not get a second chance.
ModelStack's restaurant financial model template pre-builds the item-level mix analysis, the weighted contribution margin calculation, the fixed cost stack, and the scenario comparison. It plugs into a Toast, Square, or Lightspeed export in about 20 minutes and produces the break-even threshold before and after any proposed menu change. If you are planning a value platform, a menu refresh, or a price increase in the next 90 days, the model pays for itself the first time it stops a bad launch.
Sources
- Brinker International Q2 FY2025 Earnings Release, January 29, 2025
- Dine Brands Q4 2024 Earnings Materials, February 26, 2025
- Bloomberg, Red Lobster Bankruptcy Filing Coverage, May 19, 2024
- National Restaurant Association 2024 State of the Restaurant Industry Report
- Federal Reserve Bank of Kansas City Economic Research, Food Service Margins Q4 2024
- Toast 2024 Restaurant Industry Report
- Darden Restaurants Q1 FY2025 Earnings Call, September 19, 2024
- AICPA 2024 Restaurant Industry Benchmark Report
Related: Browse all Best Financial Model Templates on ModelStack.
Get started with a free template
Download our free Unit Economics Calculator — no signup required.