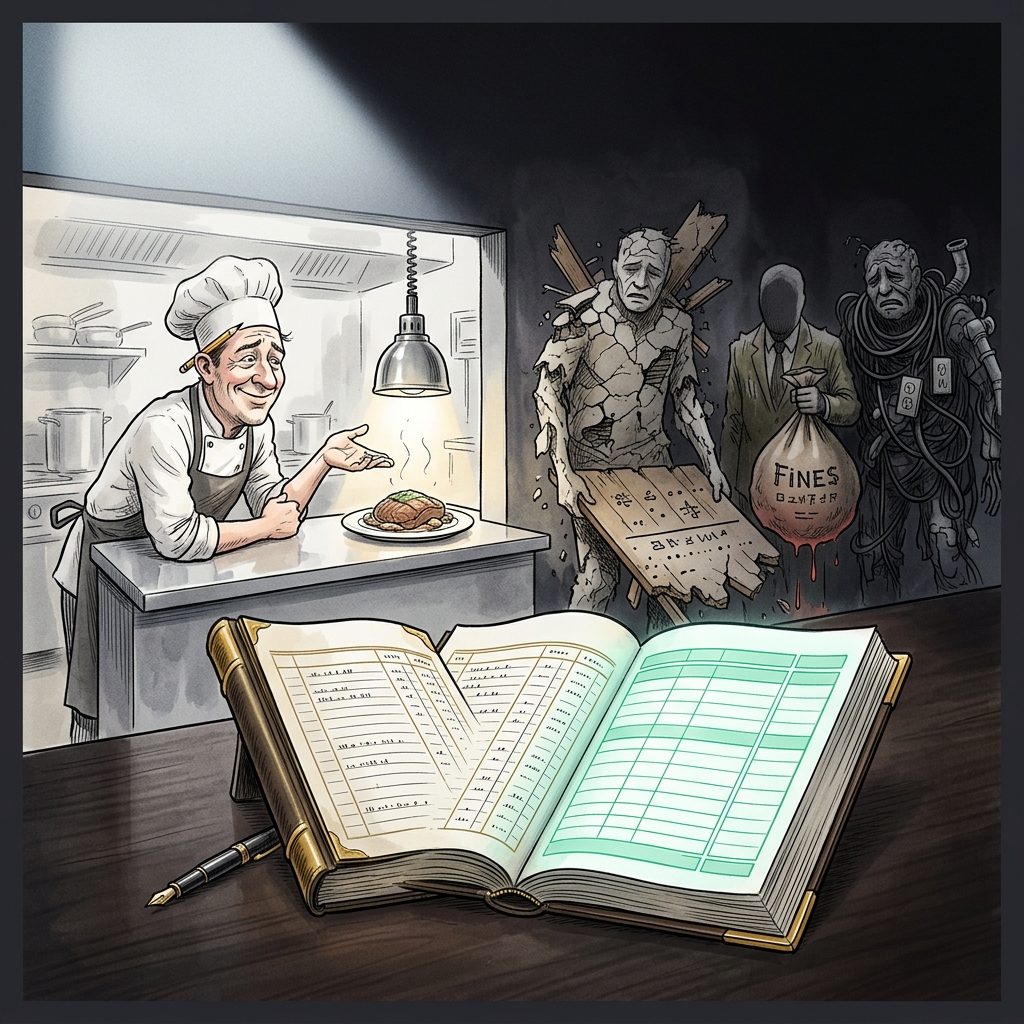
What Prime Cost Actually Measures — And Why It's an Incomplete Picture
Restaurant prime cost is the sum of Cost of Goods Sold (food and beverage) plus total labor (wages, payroll taxes, and benefits), expressed as a percentage of sales. The industry benchmark is 55–60% of sales for quick-service and 60–65% for full-service operations. The blind spot: prime cost stops at the kitchen door and the time clock. It excludes three structural expenses — payment processing, third-party delivery commissions, and food waste — that routinely consume 8–15 points of revenue and are the actual reason restaurants miss break-even even when their prime cost looks "in range."
According to the National Restaurant Association's August 2025 Restaurant Operations Data Abstract, the median full-service restaurant earned just 2.8% pre-tax income on sales; limited-service medians sat at 4.0%. With margins that thin, an operator who calculates break-even using prime cost alone — and assumes a 35% gross margin floor — will misforecast the break-even sales volume by hundreds of thousands of dollars per year. This guide walks through the three excluded expenses, gives you the corrected break-even calculation, and shows you the Excel template structure that bakes them in.
The Standard Prime Cost Break-Even Formula (And Where It Breaks)
Most operators learn this version of the break-even equation in their first management role:
- Break-Even Sales = Fixed Costs ÷ (1 − Variable Cost %)
- Variable Cost % is typically modeled as Food Cost % + Variable Labor %
- Fixed Costs include rent, insurance, salaried management, utilities
Plug in realistic numbers for a $1.2M full-service concept: 30% food cost, 33% labor (NRA's 2024 median was 36.5%, per the Operations Data Abstract), and $25,000/month in fixed costs. The model spits out a break-even of roughly $810,000 — which feels generous against $1.2M projected revenue. The operator signs the lease.
Twelve months later, the P&L shows a loss. The food and labor lines are inside benchmark. What happened? Three line items that never entered the formula consumed the entire forecast margin. Below are the three expenses, with the public data on what each one actually costs, and the step-by-step adjustment to make your break-even calculation real.
Blind Spot 1: Payment Processing Fees Are Now the Third-Largest Operating Expense
The Nilson Report figures cited across industry coverage in March 2025 put total U.S. merchant interchange and processing fees at $187.2 billion in 2024 — roughly 70% above pre-pandemic levels. For every $100 in card payments accepted in 2024, U.S. merchants paid $1.57 to card networks and processors. In restaurants, where card penetration on tickets routinely exceeds 80%, the effective cost on total sales lands between 2.0% and 3.2% depending on processor, ticket size, and card mix (corporate cards and rewards cards carry higher interchange).
The practical implication: industry coverage from SignaPay and Lunchbox in 2025 now ranks payment processing as the third-largest line item in a typical restaurant P&L, behind only food and labor. Yet prime cost excludes it entirely.
How to model it correctly:
- Pull the last three months of your processor statements (Square, Toast, Stripe, Clover, or your acquirer).
- Divide total processing fees by gross sales to get your blended effective rate. Most full-service operators land at 2.6–3.0%.
- Add that number as a separate variable cost line in your break-even model. Do not bury it in "other operating expenses" — it scales with revenue and belongs in the denominator.
- Re-run break-even. On the $1.2M concept above, a 2.8% processing rate adds $33,600 of variable cost — pushing break-even sales up by roughly $50,000 per year.
Takeaway: If your processor statement shows an effective rate above 2.8%, request an interchange-plus quote from two competitors before your next quarterly review. A 40-basis-point reduction on $1.2M is $4,800 — directly to the bottom line.
Blind Spot 2: Third-Party Delivery Commissions Cannibalize Margin in a Way COGS Doesn't See
DoorDash publicly markets three commission tiers — Basic at 15%, Plus at 25%, and Premier at 30%, with an additional 6% on pickup orders that comply with in-store price matching. Uber Eats uses a variable structure influenced by distance, order size, and time of day, with delivery commissions also reaching 30%. Industry coverage from Rezku, Food On Demand, and Labrador AI through 2025 and into 2026 consistently shows that when you add promoted-listing fees, error adjustments, and customer refunds, the effective cost lands between 30% and 40% of the gross order value.
Here is the math operators miss. A $40 delivery order at 30% effective commission nets you $28 in deposited revenue. Your 30% food cost is calculated on the $40 menu price, not the $28 deposit — so a meal that "should" cost you $12 to make is now $12 against $28 of actual revenue. That is a 43% food cost on that ticket, not 30%. Run that through 25% of your sales mix and the blended food cost on your P&L looks fine, but your delivery channel is bleeding 13 points of margin per order.
The corrected break-even adjustment, step by step:
- Pull the channel mix report from your POS: dine-in, pickup, native online ordering, and each third-party platform separately.
- For each third-party channel, calculate the all-in commission rate from a full month of statements (gross order value minus deposited amount, divided by gross order value).
- Build a weighted variable cost percentage: for each channel, multiply (food cost % + labor % + commission %) by the channel's share of sales, then sum.
- Use that weighted number — not your blended prime cost — in the break-even denominator.
For a concept where 25% of sales come through third-party platforms at a 30% effective commission, the weighted variable cost climbs roughly 7.5 percentage points above the dine-in-only assumption. That alone moves break-even by $90,000–$120,000 of annual sales on a $1.2M revenue base.
Takeaway: Run a channel-level contribution margin every month. If any third-party channel shows negative contribution margin after commission, either raise menu prices on that platform (most operators raise by 15–20% on third-party menus) or shut the channel off and redirect spend to your native ordering.
Blind Spot 3: Food Waste Is Inside Your COGS But Invisible in Your Break-Even
This one is more subtle. Your COGS line already includes waste — that's why it's calculated on purchases consumed, not menu cost. The problem is that prime cost benchmarks assume waste is at industry "normal," when most operators are running well above it. According to Move For Hunger's industry analysis and the Champions 12.3 hospitality sector reporting, restaurants waste 4–10% of food purchased, and 30–40% of food served is never eaten. Food waste accounts for an estimated 14% of total expenses for restaurants and catering establishments.
Translate that into the break-even formula: if your food cost is sitting at 32% but 6% of that is waste (versus a 3% theoretical), three points of revenue are being eliminated before they ever reach the gross margin line. On $1.2M of revenue, that is $36,000 of recoverable margin — more than most operators net in a year.
How to surface waste inside your break-even model:
- Calculate theoretical food cost — what your sales should have cost based on recipe cards and menu mix — using your POS sales report and a recipe cost calculator.
- Compare to actual food cost from your invoices and inventory counts. The gap is your real waste percentage.
- Add the gap as a separate "waste reserve" line in your break-even model. Even a 2-point gap on $1.2M is $24,000 you need to earn back somewhere.
- Track week-over-week. Champions 12.3 reported that a 20% reduction in waste across the global hospitality sector would save the industry roughly $7 billion annually — at the unit level, even a one-point waste reduction on a $1.2M operation is $12,000 of pure margin.
Takeaway: Do a one-week prep waste log. Have your kitchen team weigh and record everything that hits the trash before service — trim, expired prep, overproduction. Most operators are shocked by what week one reveals; the number rarely matches what they were assuming in their P&L.
The Corrected Break-Even Formula
Once you bake all three blind spots into the equation, the formula becomes:
- Break-Even Sales = Fixed Costs ÷ (1 − [Weighted COGS + Weighted Labor + Effective Processing % + Weighted Delivery Commission % + Waste Variance])
Re-running the $1.2M example with realistic adjustments:
- Food cost: 32% (3 points of waste variance above theoretical)
- Labor: 33%
- Payment processing: 2.8%
- Weighted delivery commission (25% of sales × 30% effective): 7.5%
- Total variable cost: 75.3%
- Fixed costs: $300,000/year
- Corrected break-even: $1,214,575 — meaning the concept needs to sell above its projected $1.2M just to zero out.
That is the real reason restaurants miss budget while their prime cost looks fine. The standard formula is solving for a different question than the one operators need answered.
Building This Into Your Operating Model
The corrected break-even isn't a one-time exercise — it needs to live in a spreadsheet model your operator updates monthly, with sensitivity tables for channel mix, processing rates, and waste variance. Building that from scratch in Excel takes most operators 6–10 hours of formula work, plus another 4–6 hours validating it against the P&L.
ModelStack's restaurant financial templates include a break-even model with all three blind spots pre-built into the variable cost stack, a channel-level contribution margin tab, a theoretical-vs-actual food cost reconciler, and a sensitivity table that shows you how much each variable moves your break-even sales requirement. Drop in your last three months of P&L, processor statements, and channel mix from your POS — the model recalculates the corrected break-even in under 10 minutes. If you're an operator, a consultant scoping a turnaround, or a banker underwriting restaurant deals, having the corrected formula prebuilt is the difference between a model that matches reality and one that doesn't.
Sources
- National Restaurant Association, "New Resource Provides Insights into Operational Realities," August 2025
- NetSuite, "11 Key Restaurant Benchmarks to Measure in 2025"
- Nilson Report coverage, "Merchant Processing Fees in the United States Exceeded $187 Billion in 2024," March 2025
- SignaPay, "Credit Card Fees Are Eating Restaurant Profits"
- Lunchbox, "The State of Restaurant Digital Payments in 2025"
- Rezku, "Third-Party Delivery Fees: What DoorDash, Uber Eats & Grubhub Really Cost Restaurants"
- Move For Hunger, "Beyond the Menu: Food Waste in America's Restaurant Industry"
- Paytronix, "Optimize Average Restaurant Rent as a Percentage of Sales"
Related: Browse all Best Financial Model Templates on ModelStack.
Get started with a free template
Download our free Unit Economics Calculator — no signup required.