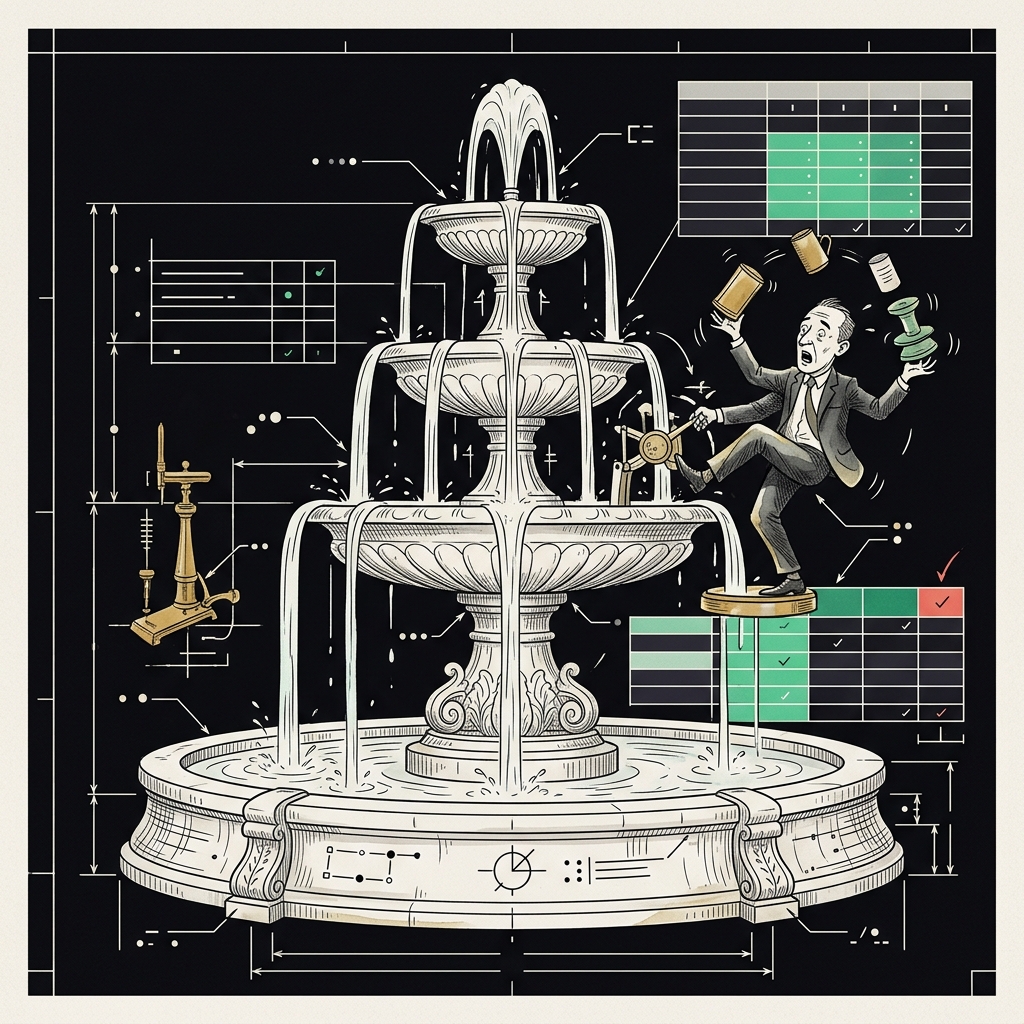
What a Three-Statement Financial Model Actually Is
A three-statement financial model is an integrated Excel workbook that projects a company's income statement, balance sheet, and cash flow statement together, so that every assumption about revenue, costs, or capital flows through all three statements without breaking the accounting identity. It is the foundational layer that underpins every DCF, LBO, merger model, or operating budget you will ever build. If the three statements don't tie, nothing downstream is trustworthy.
According to Wall Street Prep's three-statement model guide, the cash flow statement is "a pure reconciliation of the year-over-year changes in the balance sheet" — which is exactly why integration matters. Skip the linkage and you end up with a forecast where net income grows but cash mysteriously evaporates. This guide walks through how to build a step-by-step three-statement model in Excel, the assumptions that actually move the answer, and a free download checklist you can use to pressure-test your own spreadsheet.
Step 1: Pull the Historicals Before You Forecast Anything
Every clean three-statement model starts with three to five years of audited historicals laid out side-by-side. For a public company, the source is the 10-K. For private companies, it's the audited GAAP financials plus a trial balance. The mistake juniors make is forecasting before reconciling — if your historical balance sheet doesn't balance, the projected one won't either.
Use Microsoft's FY2024 10-K as a worked example. Microsoft reported $245.1 billion in revenue, $109.4 billion in operating income, and $88.1 billion in net income for the year ended June 30, 2024. Drop those numbers into your model, then trace every line down to the cash flow statement and confirm ending cash on your balance sheet matches the cash flow reconciliation to the dollar.
Concrete checklist for the historical block:
- Income statement: revenue → COGS → gross profit → opex → EBIT → interest → taxes → net income
- Balance sheet: tie ending retained earnings to prior period + net income − dividends
- Cash flow: start from net income, walk through working capital, capex, financing
- Check: balance sheet balances within $0 (not "within rounding") for every historical year
Takeaway: If you can't make the historicals tie, stop and fix the source data. Forecasting on a broken base just compounds the error.
Step 2: Build the Revenue Driver — Not a Single Growth Rate
The single biggest difference between a junior analyst's spreadsheet model and an institutional-quality one is the revenue build. A top-line "grow revenue 8% per year" assumption is lazy and unauditable. Senior operators decompose revenue into the actual units that drive it: volume × price, customers × ARPU, stores × sales per store, or contracts × average contract value.
Look at how Reddit's 2024 S-1 decomposed its revenue: advertising revenue (the bulk of it) was a function of daily active users, ad impressions per user, and revenue per impression — and the company disclosed $203 million in data licensing arrangements with a $66.4 million minimum to be recognized in 2024. That's the level of granularity an investor expects. A forecast that says "Reddit ad revenue grows 25%" without that decomposition is just hope dressed up in a spreadsheet.
Practical revenue-build framework:
- Identify the two or three primary drivers (e.g., users × monetization, units × ASP)
- Forecast each driver separately with stated assumptions
- Cross-check against management guidance, sell-side consensus, and historical cohort behavior
- Build a sensitivity table on the top two drivers — if a 100 bps move in one driver changes EBITDA by more than 10%, that's the lever to defend
Takeaway: Defend every dollar of forecast revenue with an underlying unit. If a partner can ask "why" and your answer is "because that's the growth rate I picked," you haven't built a model — you've built a slide.
Step 3: Forecast Operating Costs With the Right Cost Behavior
The next mistake is treating every expense as a percentage of revenue. Some costs scale with revenue (COGS for a product company, payment processing for a marketplace). Others are step-fixed (rent, headcount tiers, software licenses). Others are largely fixed in the short run and only step up at growth inflection points (R&D, G&A).
The Corporate Finance Institute's guidance on three-statement models recommends supporting schedules for working capital, fixed assets, debt, and equity — precisely because hiding these mechanics inside the main statements obscures the assumptions. Build a separate schedule for each material cost category and reference it into the income statement.
Cost classification cheat sheet:
- Variable with revenue: COGS, sales commissions, payment processing, shipping
- Variable with headcount: salaries, benefits, payroll tax, equipment
- Step-fixed: rent, software stack, insurance, professional fees
- Discretionary: marketing, R&D, T&E — these are the management levers
Takeaway: Force yourself to name the cost behavior for every line. "% of revenue" is sometimes right and often wrong. Get this wrong and your operating leverage assumption is fiction.
Step 4: Working Capital — Where Net Income and Cash Diverge
This is the section where most models break, and it's also where the cash flow statement either earns its keep or collapses into noise. Working capital is forecast using days-based ratios — Days Sales Outstanding (DSO), Days Inventory Outstanding (DIO), and Days Payable Outstanding (DPO) — applied to the projected income statement.
According to JPMorgan's treasury insights on DSO and DPO, these two metrics together determine how much cash a growing business actually generates versus how much it locks up in the balance sheet. A company growing 30% with a 90-day DSO can show strong accounting profit and run out of cash at the same time. That mismatch is exactly what the three-statement model is built to expose.
The mechanics in Excel:
- DSO = (Accounts Receivable / Revenue) × 365 — forecast forward, multiply by projected revenue, divide by 365 to get projected AR
- DIO = (Inventory / COGS) × 365 — same logic, applied to COGS
- DPO = (Accounts Payable / COGS) × 365 — same logic, applied to COGS
- Change in working capital flows to the operating section of the cash flow statement as a use (if WC grows) or source (if WC shrinks) of cash
The working capital cycle formula from Wall Street Prep — DIO + DSO − DPO — gives you the cash conversion cycle in days. If your model has the cycle stretching out year over year without an operational reason, you've quietly built in a cash crunch.
Takeaway: Working capital is where junior analysts get caught. Senior reviewers go straight to the WC schedule first. Make yours bulletproof.
Step 5: Capex, Depreciation, and the Debt Schedule
Three supporting schedules drive most of the remaining linkages: the PP&E rollforward (beginning balance + capex − depreciation = ending balance), the depreciation schedule (existing PP&E depreciation + new capex depreciation), and the debt schedule (beginning balance + new issuances − repayments = ending balance, plus interest expense calculated on average balance).
The CFI guide on supporting schedules is explicit that these belong on separate tabs, not buried in the main statements. The reason is auditability. When a managing director asks "what's driving the interest expense?" you want to point at a clean schedule, not hunt through formulas.
Debt schedule build sequence:
- List each tranche separately (term loan, revolver, senior notes, etc.)
- Forecast scheduled amortization, mandatory prepayments, optional prepayments
- Calculate interest on average balance using the stated rate or a spread to a benchmark curve
- Build a revolver that automatically draws to cover any cash shortfall — this is your model's "cash sweep" mechanism
Takeaway: The revolver isn't a forecasting assumption — it's a plug that tells you whether the business needs external capital. If your revolver balance climbs every year, the business as modeled doesn't fund itself.
Step 6: Link the Statements and Audit the Balance Check
The integration step is where a three-statement model becomes a three-statement model. Net income flows from the income statement into the cash flow statement and into retained earnings on the balance sheet. Depreciation flows from the schedule into the income statement and as an add-back on the cash flow statement. Capex flows from the schedule into the cash flow statement as an investing outflow and into PP&E on the balance sheet. Debt issuances and repayments flow from the debt schedule into the cash flow statement and into the long-term liabilities section of the balance sheet.
The single audit check that matters: does the balance sheet balance in every projected year, to the dollar? If it does, your linkages are right. If it doesn't, the gap equals the error somewhere upstream — most often a missing cash flow item or a sign error on a working capital change. The CFA Institute's Financial Modeling Practical Skills Module emphasizes that linking statements correctly is the technical skill that separates a usable model from a decorative one.
Final audit checklist:
- Balance sheet balances in every period (check =Assets − Liabilities − Equity, expect $0)
- Ending cash on balance sheet = ending cash on cash flow statement
- Retained earnings rollforward ties (prior + NI − dividends)
- PP&E rollforward ties (prior + capex − D&A)
- Debt rollforward ties on every tranche
- Interest expense ties to average debt × rate
- No hard-coded numbers inside formulas — all inputs traceable to a blue cell
Takeaway: A three-statement model that doesn't balance is worse than no model, because it gives you false confidence. Build the audit checks into the model itself with conditional formatting that turns red when something breaks.
Why a Ready-Made Template Compounds Your Speed
Building a three-statement model from a blank Excel file takes a strong analyst eight to twelve hours, and the first version usually has at least one balance check error that takes another two hours to track down. The frameworks above are the right way to think — but at deal speed, you don't have eight hours. You have a Friday afternoon ask and a Monday morning meeting.
A pre-built three-statement template solves the mechanical 80%: the structure, the linkages, the supporting schedules, the audit checks, and the formatting standards that the CFI guide and Wall Street Prep curriculum codify. What you do with the remaining 20% — the revenue drivers, the cost behavior, the working capital assumptions specific to your business — is where the analytical judgment lives, and it's where you should be spending your time. The ModelStack three-statement template gives you the chassis so you can focus on the engine.
Sources
- Wall Street Prep — 3-Statement Model: Complete Guide (Step-by-Step)
- Corporate Finance Institute — What is a 3-Statement Model? Your Complete Guide
- Corporate Finance Institute — Supporting Schedules in 3-Statement Financial Modeling
- CFA Institute — Financial Modeling Practical Skills Module
- Microsoft Corporation — Form 10-K FY2024 (SEC filing)
- Reddit, Inc. — Form S-1, February 2024 (SEC filing)
- JPMorgan — DSO & DPO: How They Can Improve Your Cash Flow
- Wall Street Prep — Working Capital Cycle: Formula + Calculator
Related: Browse all Best Financial Model Templates on ModelStack.
Get started with a free template
Download our free Unit Economics Calculator — no signup required.