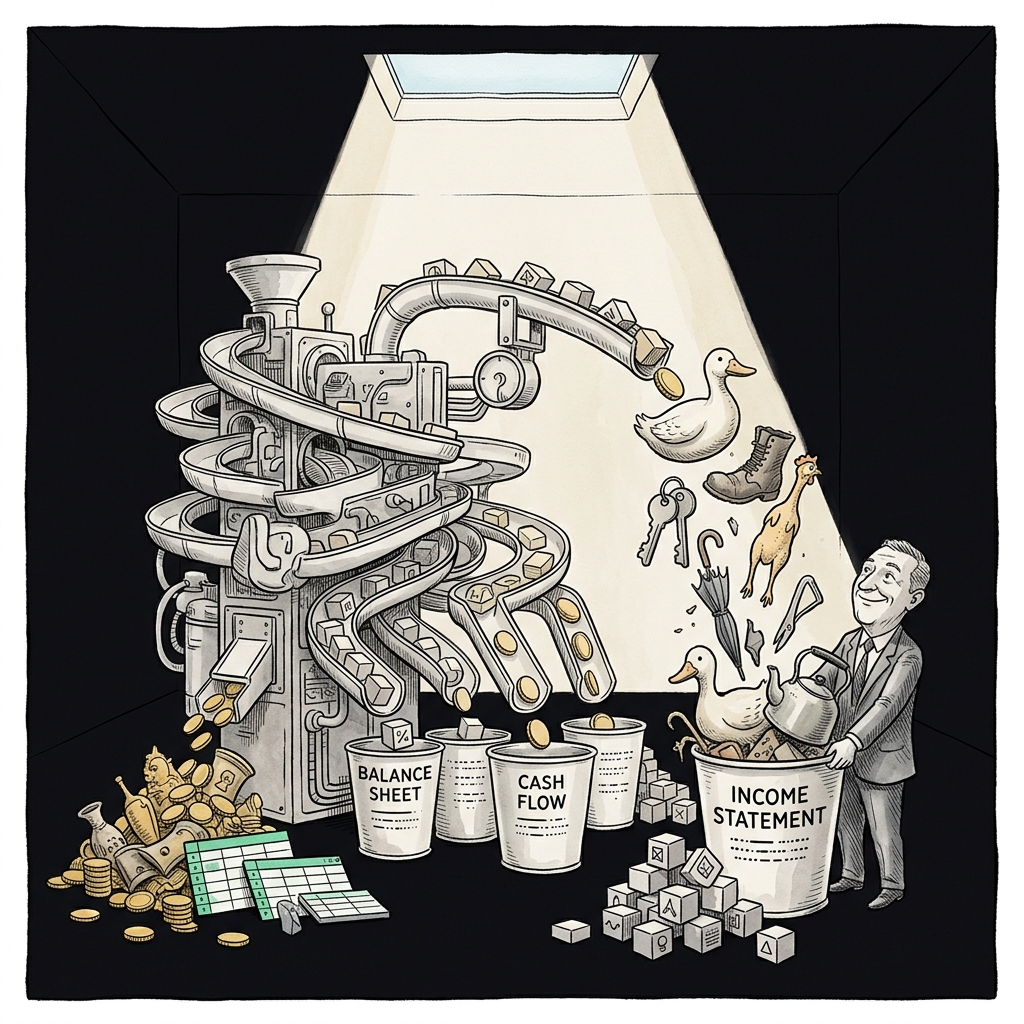
A financial statement generator is a tool that turns a raw trial balance into a formatted income statement, balance sheet, and cash flow statement by assigning each general ledger account to a line item on those reports. Without a correct trial balance mapping layer, the generator produces numbers that tie to the ledger but not to GAAP, and the resulting income statement will misclassify revenue, hide operating expenses inside COGS, or double-count intercompany balances. This is the single most common reason auto-built statements need to be redone before a board meeting or an audit.
Why auto-built income statements break without trial balance mapping
The trial balance is a flat list of every account in the general ledger with its debit or credit balance as of a date. A financial statement generator takes that list and drops each account into a bucket on the income statement, balance sheet, or cash flow. If the bucket assignment is wrong, the totals are wrong. If the bucket assignment is missing, the account gets dumped into an "unmapped" line, or worse, silently excluded.
Three failure modes cause almost every broken auto-built statement:
- A new GL account is added mid-period, no one updates the mapping, and its balance vanishes from the report.
- An account is mapped to the wrong parent line, for example a merchant processing fee sitting under "Other Income" instead of "Cost of Revenue".
- The mapping uses cell references instead of account codes, so a reordered trial balance sends the formulas to the wrong rows.
The consequences scale with the audience. A misclassified $50,000 line on a monthly management pack is a footnote. The same error on an SEC filing is a restatement. Audit Analytics data cited by TheCorporateCounsel.net in June 2025 shows non-accelerated filers still accounted for 45% of all 2024 restatements, with income statement and balance sheet misclassification a recurring category in the last decade. Practical next step: run a five minute audit of your generator by summing every mapped line and comparing to the raw trial balance total. Any gap is an unmapped account.
What trial balance mapping actually does
Mapping is a lookup table. The left side lists every account code in your chart of accounts. The right side lists the financial statement line each account should roll up to. Every posted transaction in your ledger, from petty cash to depreciation, needs one and only one destination.
A minimum mapping for a single-entity company has three columns:
- Account code from the GL, for example 4100 for Product Revenue.
- Account name, for example "Product Revenue, US".
- Financial statement line, for example "Revenue > Product > US".
A working mapping for a company with subsidiaries adds four more: entity code, elimination flag, currency, and a cash flow classification. NetSuite's own trial balance report documentation notes that income statement accounts on the trial balance only include transactions posted from the beginning of the calendar year up to the "as of" date, which means the same account can produce different numbers depending on how the report is run. Your mapping has to handle both period-to-date and year-to-date pulls, or the same generator will spit out two contradictory income statements from the same ledger.
Practical next step: export your current chart of accounts, add a "Statement Line" column next to each account, and fill in the roll-up target. You will find accounts nobody has touched in three years, and accounts that two people are using for different things. Both need resolving before any generator can produce a correct statement.
Where financial statement generator tools fail in practice
QuickBooks Online, Xero, and NetSuite all ship built-in financial statement generators. Each one relies on a mapping layer, and each has documented gaps. QuickBooks and Xero, for example, do not export trial balances with department, class, or location segments intact, which means a segment-aware report built downstream in Excel or a consolidation tool has to reconstruct segment splits from separate reports.
Four failure patterns show up over and over:
- Silent exclusions. A new account is created, no mapping rule exists, the generator has no default bucket, and the balance is dropped from the statement without an error. The trial balance still foots, so nothing looks wrong.
- Mapped to the wrong line. An account like "Merchant fees" gets mapped to Operating Expenses when it should be contra-revenue or a component of Cost of Revenue. Gross margin then looks 200 basis points too high.
- Cell-based formulas break on reorder. An Excel model that references Trial_Balance!B47 for Cash breaks the moment a new account is inserted at row 30. Every downstream number shifts by one row.
- Intercompany balances not eliminated. The consolidated income statement double-counts intercompany revenue because the mapping does not carry an elimination flag.
The SEC's May 3, 2021 press release announcing Under Armour's $9 million penalty is a public example of what happens when reported revenue lines look correct at the statement layer while the underlying treatment is wrong. Regulators found Under Armour had pulled forward $408 million in customer orders over six consecutive quarters starting Q3 2015 to close gaps against analyst estimates. Mapping did not cause that disclosure failure, but the same failure category, reported numbers that reconcile to the ledger while masking what is actually happening in the accounts, is what a disciplined mapping and reconciliation process is designed to catch early.
Practical next step: run last month's trial balance through your generator and reconcile the sum of every mapped line back to the trial balance total. Any variance is either an unmapped account or a rule collision. Fix both before you close the next period.
A working mapping process, step by step
The process below is what a controller at a Series B software company would use, and it works the same way at a five billion dollar revenue business. The tooling scales, the logic does not change.
- Export the full chart of accounts. Pull every active and inactive account, with codes and descriptions. Inactive accounts still hold historical balances and still flow through prior period statements.
- Define the statement line taxonomy first. Write out the income statement and balance sheet at the level of detail you want to publish. Revenue by segment, cost of revenue split between product and service, and opex by function. This is your target.
- Map account to line, one to one. Every account gets exactly one destination. If two accounts should net together, they still get mapped separately and net at the roll-up level.
- Add the cash flow classification. Every balance sheet account and every income statement account gets tagged as operating, investing, or financing so an indirect method cash flow statement can be built without a second mapping pass.
- Version the mapping. Store the mapping file somewhere with version history. A change in Q3 that reclassifies an account will change Q2 comparatives, and you need to know why the number moved.
- Add validation checks. Assert that every account in the trial balance appears exactly once in the mapping, that debits equal credits at the mapped level, and that any unmapped account throws an error rather than being silently dropped.
- Run parallel for one close. Build the new mapped statement alongside your current statement for a full month. Reconcile line by line. Only cut over when every variance is explained.
Practical next step: the validation checks in step 6 are the ones that get skipped, and they are the ones that catch real errors. Write them before you write the mapping formulas.
Building the mapping in an Excel template
Excel is still the working environment for most financial statement mapping, even at companies running Workiva or OneStream for the final publication step. The reason is that mapping logic is easier to review, override, and audit inside a spreadsheet than inside a black-box connector.
A working Excel template for a free download or an internal build has five tabs:
- TB_Import. The raw trial balance, pasted or connected via an ODBC or CSV import.
- Mapping. The lookup table with account code, account name, statement line, cash flow class, elimination flag, and entity.
- IS_Output. The formatted income statement, built with SUMIFS against the mapped trial balance.
- BS_Output. The formatted balance sheet, same SUMIFS pattern.
- Validation. The checks (mapping completeness, TB foots, IS + BS ties to TB, no unmapped accounts).
The critical formula is SUMIFS, never VLOOKUP. VLOOKUP breaks the moment your mapping is not sorted and returns the wrong value on a partial match. SUMIFS aggregates all balances for a given statement line, so it survives new accounts, reordered accounts, and split accounts without changing the output formula. Practical next step: if your current spreadsheet model uses cell references like ='Trial Balance'!B47, replace them with SUMIFS keyed on account code. It takes an afternoon and removes an entire class of period-end error.
Correctness before speed in financial statement generator tools
The speed advantage of a financial statement generator only holds if the mapping is right. A tool that produces the wrong number in three seconds is worse than a manual pull that takes three hours, because the wrong number reaches the board, the bank, and the auditors before anyone catches it. Baker Tilly's published guidance on restatements is direct that the cost of correcting an error, measured in audit fees or lost trust, runs orders of magnitude higher than the cost of building a mapping layer that prevents the error.
Grant Thornton's January 2026 guide on evaluating financial statement errors treats a mapping error as a misstatement under ASC 250 when it materially changes a reported line. Misclassifications between operating expenses and cost of revenue, and between revenue and other income, sit in the categories that most often trigger a Little r or Big R restatement. That is the risk you are managing with a mapping layer.
A ready-made Excel template with the five tabs above, a versioned mapping structure, and built-in validation checks removes the guesswork. It gives a controller, an FP&A lead, or a founder-CFO a starting point that already handles new accounts, segment splits, intercompany eliminations, and cash flow classification. The template is a starting point, since every company has a chart of accounts that reflects its own history. It is the piece you should not build from scratch on a Sunday night before a Monday board pack.
Sources
- SEC Charges Under Armour Inc. With Disclosure Failures, SEC Press Release, May 3, 2021
- Restatements: Non-Accelerated Filers Lead the Pack, TheCorporateCounsel.net, June 2025
- Data Points: Financial Restatements and Auditor Turnover, PCAOB
- Restatements: the costly result of an error, Baker Tilly
- Evaluating and correcting financial statement errors, Grant Thornton, January 2026
- 30.7 Correction of an error, PwC Viewpoint
- NetSuite Applications Suite: Trial Balance Report, Oracle NetSuite documentation
- Financial Close Reporting, Workiva
Related: Browse all Best Financial Model Templates on ModelStack.
Get started with a free template
Download our free Unit Economics Calculator — no signup required.